Unreal Engine: Easier Editor Debug Visualization
Introduction
When working in Unreal Engine, sometimes you need to visualize data in the editor for debugging or development purposes. Some engines (most lol) have a very simple and straight forward way to do this with some editor only drawing function. Unreal however, has a stronger seperation of editor and gameplay code, this isn’t to say it can’t be done easily or that there aren’t work arounds for it but it just is more difficult.
Component Visualizers Note
Unreal has a built in framework for visualizing data in the editor known as Component Visualizers, these are pretty powerful and aleady used by the engine for a number of things like lights but can also be verbose and has implicit requirements like having a specific component type or only drawing in the editor when the component is selected, sometimes this isn’t the desired behaviour but instead you want to draw something in the editor regardless of the component or object or even if its selected at all.
Component visualizers are still a great tool but I wont go into detail about them here since this is supposed to be a simpler alternative, but here is a great blog on them.
Overview
- Create a custom show flag or use an existing one to toggle the visibility of your debug drawing.
- Register a callback with
Handle = UDebugDrawService::Register(MyFlagsName, FDebugDrawDelegate::CreateStatic(&MyCallback))to draw whatever you want in the editor. - When finished be sure to unregister the callback with
UDebugDrawService::Unregister(Handle).
By using Unreals provided Blueprint Function Library called UDebugDrawService we can piggy back off of the drawing delegates and draw whatever we want when invoked.
The setup is actually quite simple and mostly just revolves around a callback which gives you a UCanvas* to draw into like for text or images but you can also just use normal debug drawing functions here like
DrawDebugSphereDrawDebugLineDrawDebugCapsule- Etc.
Setup
For this example I will create an editor only module named “MyProjectEditor” of type “UncookedOnly” so I can have my drawing functions isolated and neatly kept out of gameplay code but there is nothing stopping you from placing the registration and drawing code in a regular gameplay object, the code should however be stripped from final packages with the use of preprocessor directives like #if WITH_EDITOR or #if !UE_BUILD_SHIPPING etc.
NOTE: Even when packaged in stand alone the engine still invokes any functions registered with
UDebugDrawServiceviaUGameViewportClient::Draw- without looking too far into it, it seems thatFSceneViewportwill always create a newFDebugCanvasDrawerfrom the constructor leading to the debug canvas being valid and causing the engine to take the code path that draws all debug stuff with that canvas (even though most other debug drawing is stripped? I honestly feel like this isn’t intentional but I have no idea ultimately.) but this is another reason why it’s important to strip any registrations you make yourself from final builds otherwise it’s just pure overhead and bad practice.
First step is to create the module and register in its StartupModule and ShutdownModule functions to the UDebugDrawService.
If you’re not familiar with creating a module or plugin then I have a guide here that should help you get started.
Before showing the code I should explain a little about the visibility flags.
In order for us to register with the debug service we need to have a visibility flags name as well as a callback function that will be invoked when the flag is enabled. The flag is what drives when we can and can't see our debug drawing, this is done by toggling the flag in the editor viewport show flags menu or via console.
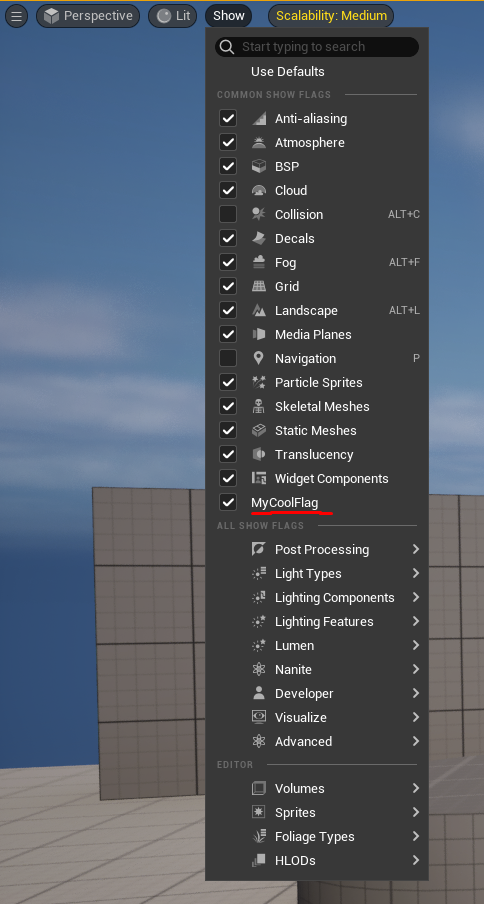
The flag can be a custom one or an existing one, for this example I will create a new flag called "MyCoolFlag" but again, you can use any of the existing flags as well, see `ShowFlagsValues.inl` for a list of epics default ones or just look in the editors show flags menu.
Epic also has an overview on their viewport show flags here if you want to learn more about them.
Simple Example
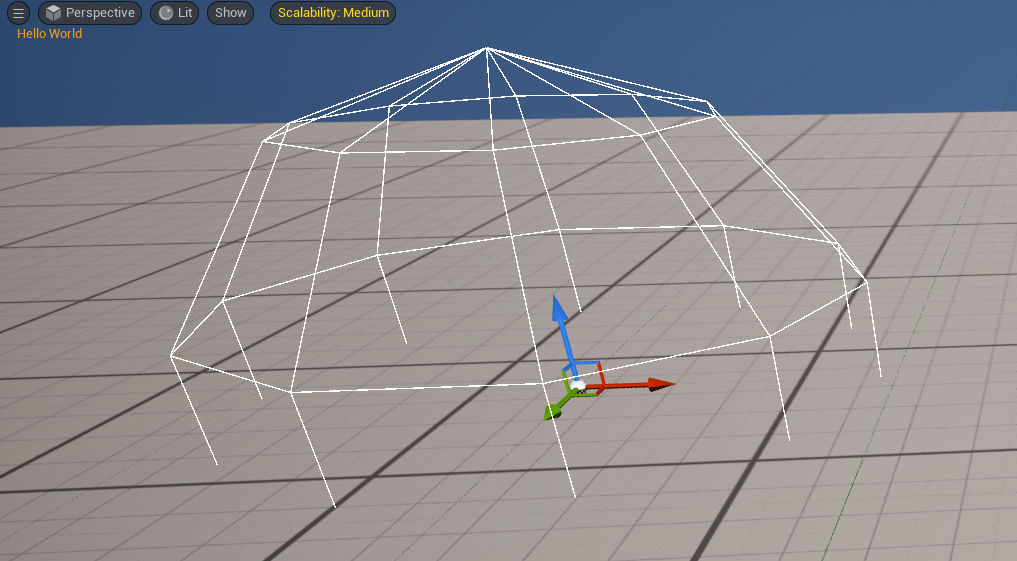
Here is how the setup looks in code, as we can see it’s bare bones and just draws some text and a sphere in the editor viewport.
Code Snippet
const TCHAR* MyShowFlagName = TEXT("MyCoolFlag");
// you can also keep show flags in shipping builds
// SFG_Normal just saves us going inside of a dropdown menu to find it
TCustomShowFlag<EShowFlagShippingValue::ForceDisabled> MyShowFlag(MyShowFlagName, true, SFG_Normal);

// Ideally you would have this in a header file or annonymous namespace,
// not a free floating function.
void MyDrawFunction(UCanvas* Canvas, APlayerController* PC)
{
    // Early out if we aren't ready to draw
    // The player controller is ALWAYS null,
    //I assume epic had plans for this but never implemented it.
    if ( !IsValid(Canvas) || !IsValid(GWorld) )
        return;

    UFont* Font = UEngine::GetMediumFont();

    Canvas->DrawText(Font, TEXT("Hello World"), 20.f, 30.f);
    DrawDebugSphere(GWorld, FVector::ZeroVector, 100, 10, FColor::White);
}

void FMyProjectEditorModule::StartupModule()
{
    // Returns a FDelegateHandle so we can later unregister
    DrawDelegate = UDebugDrawService::Register(MyShowFlagName, FDebugDrawDelegate::CreateStatic(&MyDrawFunction));
}

void FMyProjectEditorModule::ShutdownModule()
{
    UDebugDrawService::Unregister(DrawDelegate);
}
And here is the result, if you managed to get this far then that is basically all that is needed to get started!

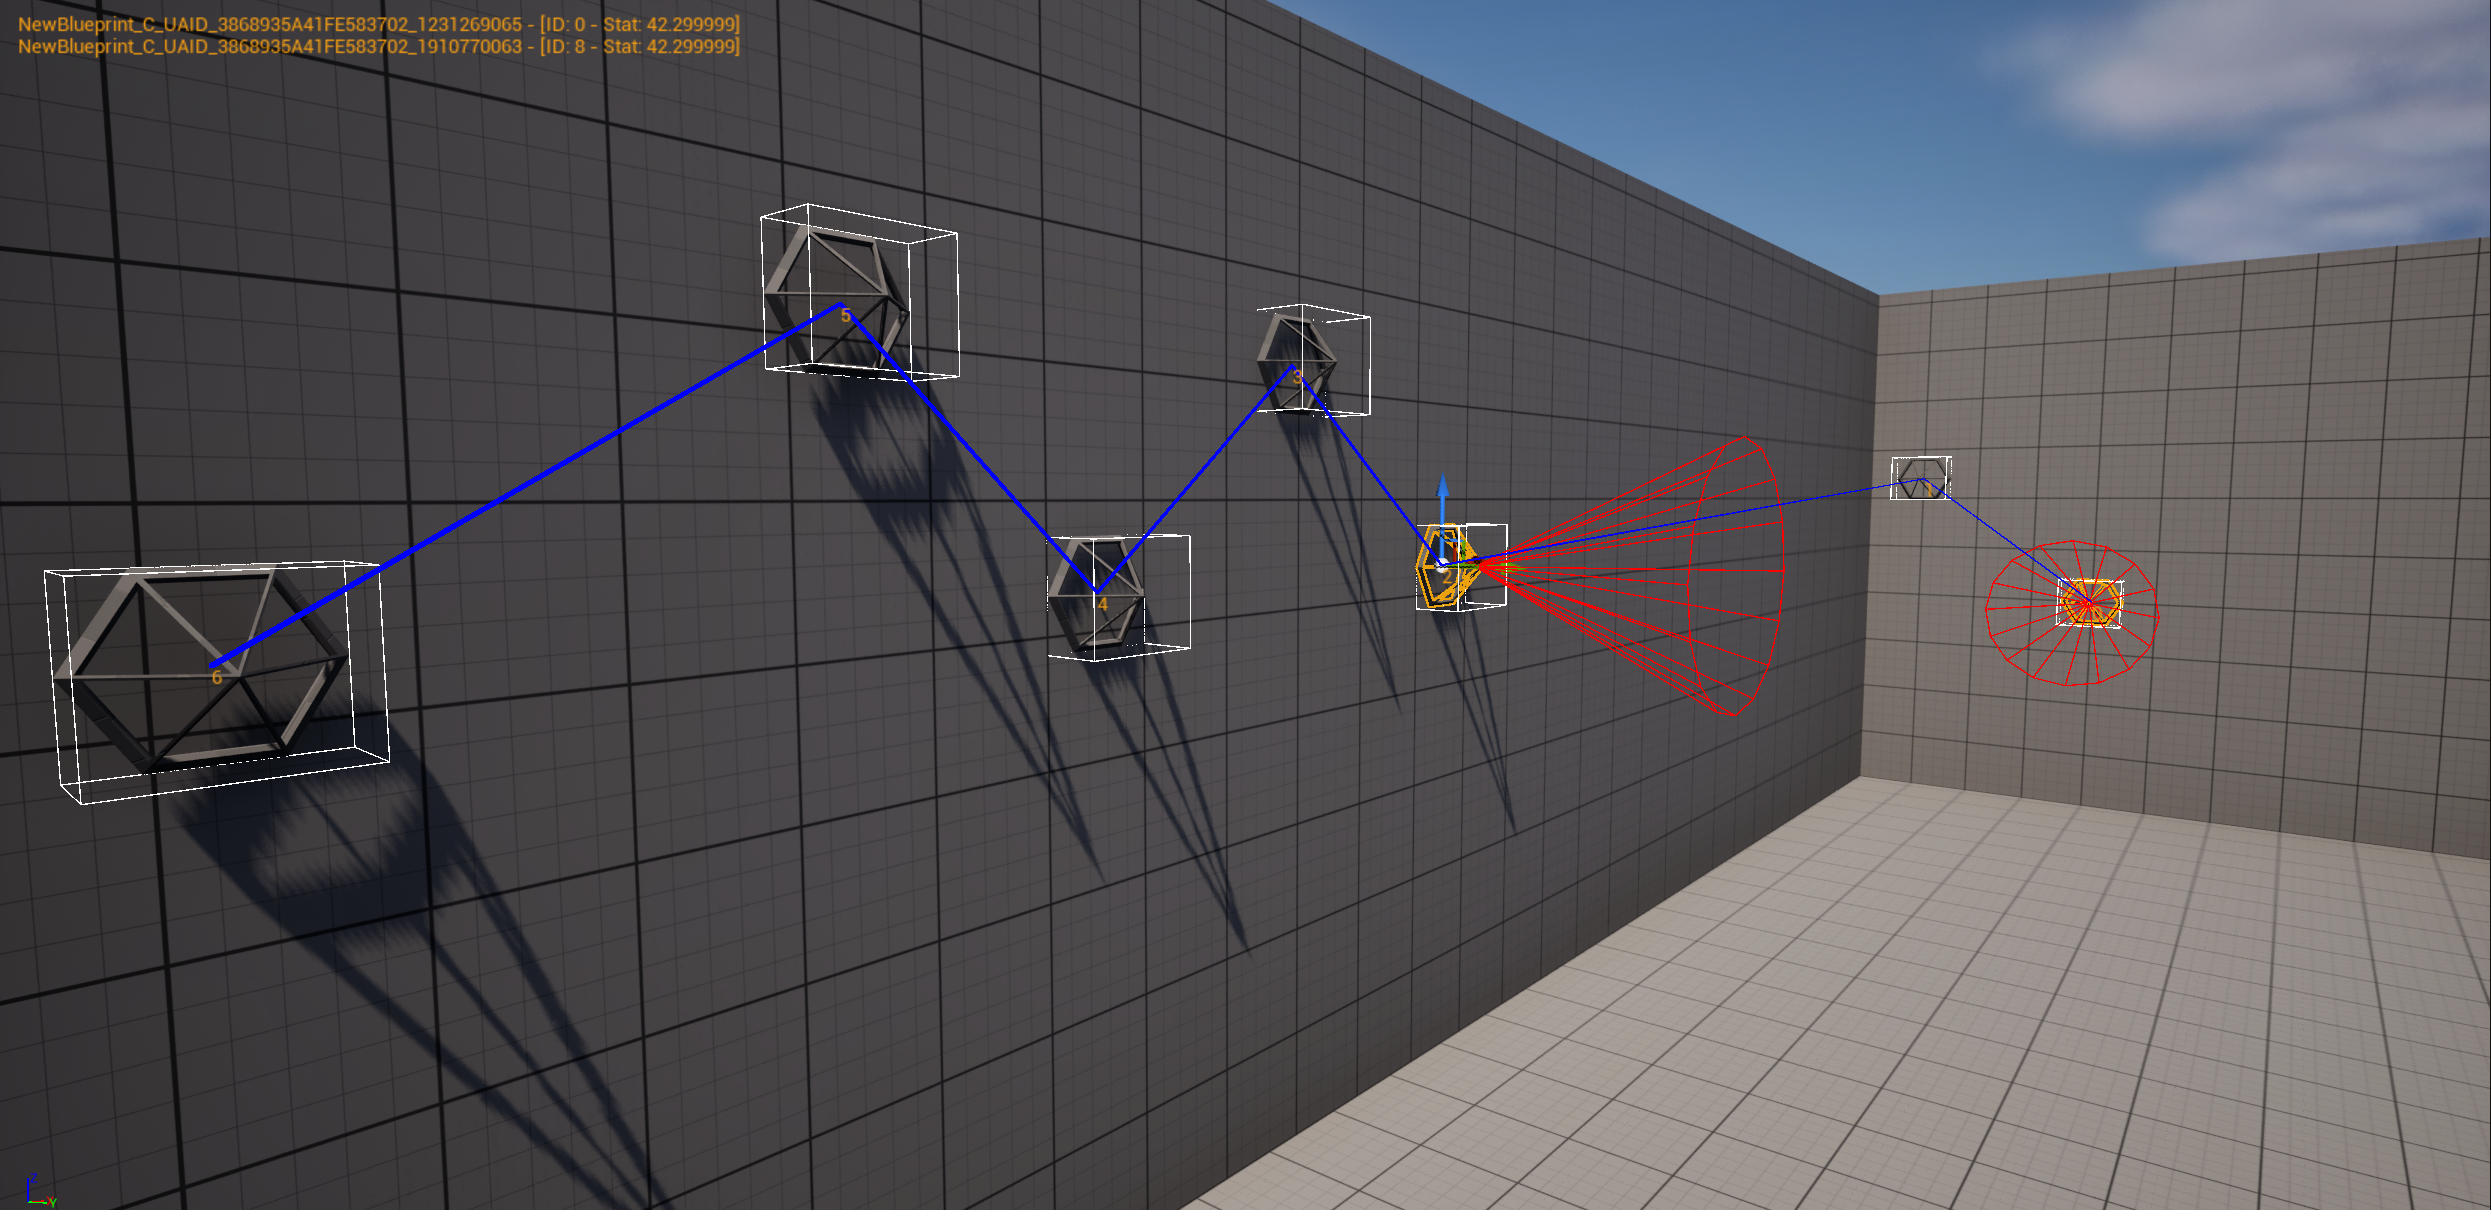
This pretty basic and boring though, so now lets start making a more complex example, for this next example lets imagine we have a bunch of actors in level that are linked in some way and it would be nice to visualize that linkage along with some extra data when a select specific actors.
Complex Example
As seen in the video above I am able to limit showing certain debug information to only when the actor is selected, this is done by iterating over the selected actors and checking if the current actor is selected.
You also see how I am able to sort and draw connections between the actors based on some arbitrary ID.
I didn’t however show me toggling the visibility flag from the editor menu but you can see from the flags example screenshot above how it would be done from either the “Show” menu but you also can toggle it at runtime through the console with commands like show MyCoolFlag.
Here is the example code for the more complex example (this is quick and dirty and not optimized but it gets the point across, debug drawing code shouldn’t need to be optimized since it’s only for debugging purposes anyway):
Code Snippet
void MyDrawFunction(UCanvas* Canvas, APlayerController* PC)
{
    // Early out if we aren't ready to draw
    if ( !IsValid(Canvas) || !IsValid(GWorld) )
        return;

    // We increment this as we add new lines to our canvas
    float YOffset = 30.f;
    constexpr float FontDrawScale = 1.5f;

    UFont* Font = UEngine::GetMediumFont();
    Canvas->SetDrawColor(FColor::Orange);

    // Locate all our actors in the world.
    TArray<AMyCoolActor*> FoundActors;
    for (TActorIterator<AMyCoolActor> IT(GWorld); IT; ++IT)
    {
        if (AMyCoolActor* Actor = *IT)
            FoundActors.Add(Actor);
    }

    // Once we have the actors I then want to sort them based on
    // their ID so we can draw from the lowest ID to the highest
    FoundActors.Sort([](AMyCoolActor& A, AMyCoolActor& B)-> bool
    {
        return A.SomeID <= B.SomeID;
    });

    for (int k = 0; k < FoundActors.Num(); ++k)
    {
        AMyCoolActor* CurrentActor = FoundActors[k];

        FVector Origin, Extent;
        CurrentActor->GetActorBounds(false, Origin, Extent);
        FVector CanvasLocation = Canvas->Project(CurrentActor->GetActorLocation(), false);


        // Draw the bounds and index for each of our actors
        Canvas->DrawText(Font, FString::FromInt(k), CanvasLocation.X, CanvasLocation.Y, FontDrawScale, FontDrawScale);
        DrawDebugBox(GWorld, Origin, Extent, FColor::White);

        // Draw the connection to the next actor if we are not the last
        if (k < FoundActors.Num() - 1)
        {
            AMyCoolActor* NextActor = FoundActors[k + 1];
            DrawDebugLine(GWorld, CurrentActor->GetActorLocation(), NextActor->GetActorLocation(), FColor::Blue, false, -1.f, 100, 2);
        }


        // Finally, for each selected actor draw a little more information
        // This requires the UnrealEd module so be sure to keep this OUT of gameplay modules
        for (FSelectionIterator Selection(*GEditor->GetSelectedActors()); Selection; ++Selection)
        {
            auto* Actor = Cast<AMyCoolActor>(*Selection);
            if (Actor == CurrentActor)
            {
                FString DisplayMsg = FString::Format( TEXT("{0} - [ID: {1} - Stat: {2}]"), {Actor->GetName(), Actor->SomeID, Actor->SomeStat});
                float XDesiredSize, YDesiredSize;

                Canvas->TextSize(Font, DisplayMsg, XDesiredSize, YDesiredSize, FontDrawScale, FontDrawScale);
                YOffset += YDesiredSize;

                Canvas->DrawText(Font, DisplayMsg, 20.f, YOffset, FontDrawScale, FontDrawScale);
                FVector Loc = Actor->GetActorLocation();
                FVector Dir = Actor->GetActorForwardVector();
                DrawDebugCone(GWorld, Loc + Dir * 40, Dir, 300.f, FMath::DegreesToRadians(25), FMath::DegreesToRadians(25), 16, FColor::Red);
                break;
            }
        }
    }
}
Summary
Hopefully after all of this you can start to see just how powerful and flexible the UDebugDrawService function library can be for visualizing data in the editor.
You could imagine cases where games have multiple custom flags and it would just make life so much easier in the editor if you need to constantly find certain actors or try visualize how some data is connected.

